
Options Advanced: Risk Management and Position Sizing
Beginners talk about risk as "don't sell naked" and "don't buy deep OTM." Advanced traders talk about risk as: Risk management isn't "what d…

Beginners talk about risk as "don't sell naked" and "don't buy deep OTM."
Advanced traders talk about risk as:
"At 2 standard deviations, how much will I lose?" "What are my portfolio's Greeks exposures across different volatility scenarios?" "What's the Kelly-optimal position size for this trade?"
Risk management isn't "what do I do if I lose" — it's "before I enter, I already know every possible outcome."
The Three-Level Risk Pyramid
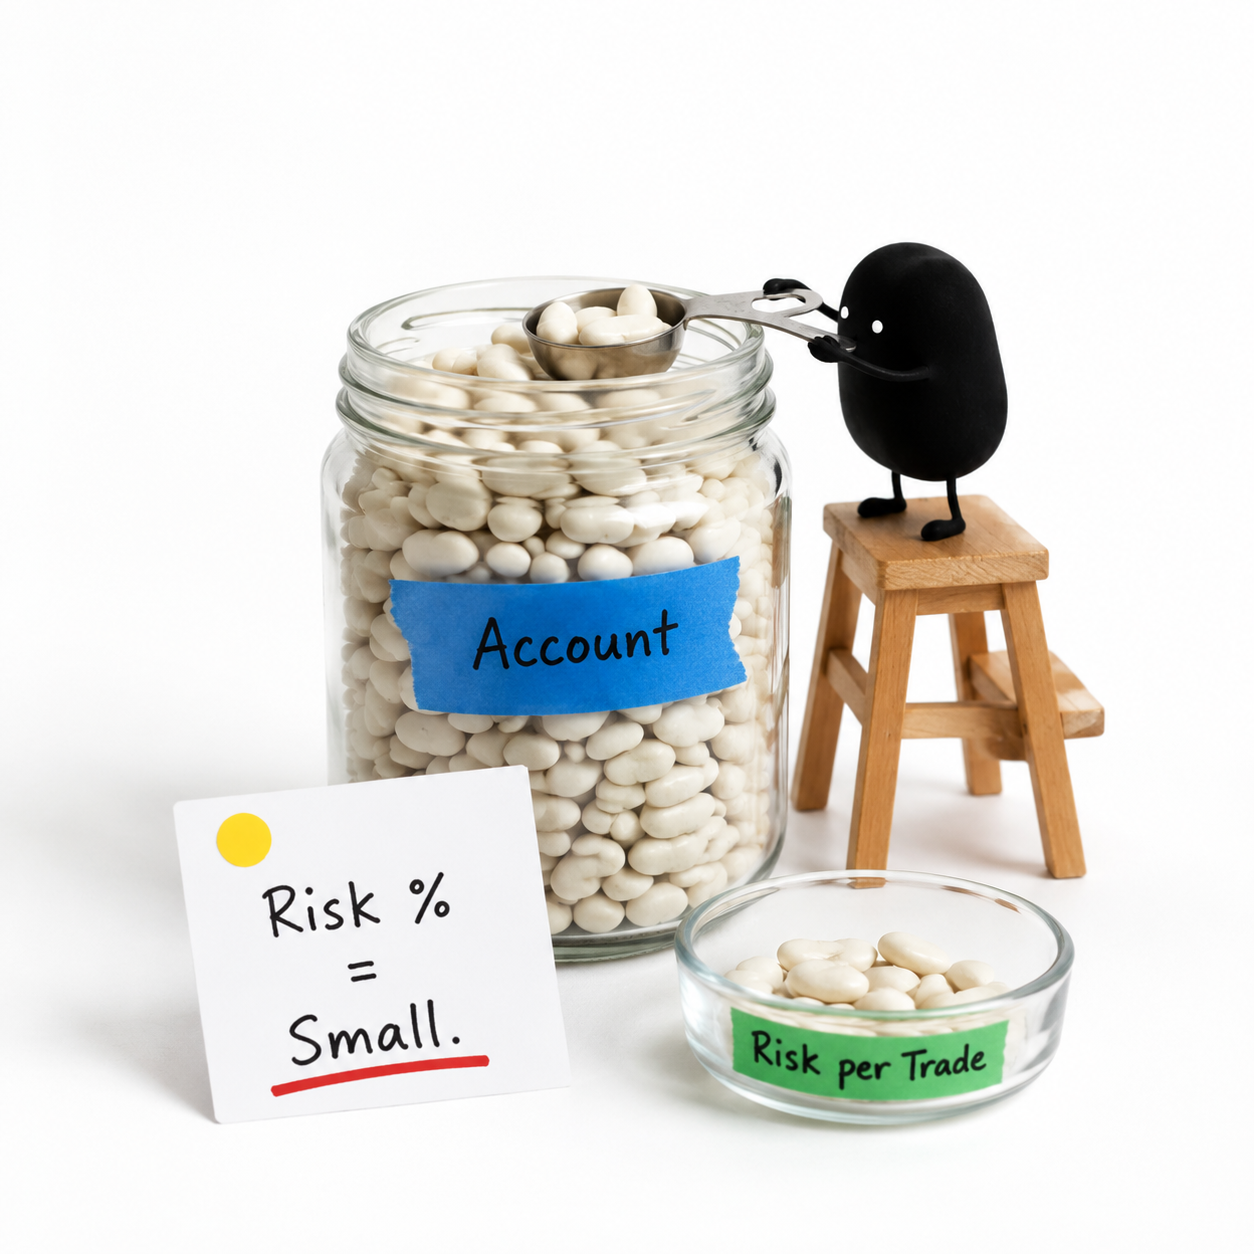
Base Level: Position Sizing
Start by deciding how much to risk on each trade.
- Core question: How much capital does this trade use?
- Risk focus: The same position size can create very different loss exposure across different option strategies.
↓
Middle Level: Stress Testing
Then test how the position behaves in extreme market conditions.
- Core question: What happens if the stock drops, volatility rises, or Gamma expands?
- Risk focus: Know the maximum loss and adjustment plan before the scenario arrives.
↓
Top Level: Strategy Resilience
Finally, judge whether the strategy itself can survive.
- Core question: Can this system handle losing streaks and changes in market structure?
- Risk focus: The goal is not just winning one trade, but keeping the whole system alive.
Base Level: Position Sizing — How Much to Risk Per Trade?
Common beginner mistake: "I only use 5% of capital per trade" is a good instinct, but 5% deployed into different options strategies creates completely different risk exposures.
Advanced method: Options-adapted Kelly Criterion
The Kelly formula calculates the optimal bet size:
f* = (p × b − q) / b
Where:
- p = win rate
- q = 1 − p (loss rate)
- b = odds (profit / loss)
Kelly adapted for options strategies:
| Strategy Type | How to Estimate Win Rate | How to Estimate Odds | Notes |
|---|---|---|---|
| Selling (short put/call) | Use Delta (Delta ≈ 0.3 → win rate ≈ 70%) | Premium / max loss | Max loss is theoretically unlimited; set a stop-loss equivalent |
| Spread (debit spread) | Delta approximation | (Strike width − cost) / cost | Max loss is known |
| Iron Condor | Sum of call and put Deltas sold | Premium received / max loss | Max loss = spread width − premium |
A simplified Kelly calculation (selling OTM put):
- You sell a Delta = 0.25 put → win rate ≈ 75% (p=0.75, q=0.25)
- Premium = $2, max loss (stop-loss equivalent) = $10 → odds b = 2/10 = 0.2
- f* = (0.75 × 0.2 − 0.25) / 0.2 = (0.15 − 0.25) / 0.2 = −0.5
Note: A negative result means this trade has negative mathematical expectation and shouldn't be taken.
Practical position sizing rules for advanced traders:
| Strategy Risk Level | Max Single-Strategy Position | Example |
|---|---|---|
| Low risk (CSP/covered call) | 10-20% | Cash-secured put |
| Medium risk (spreads/iron condor) | 5-10% | Iron condor |
| High risk (long/naked options) | 2-5% | Long straddle |
| Extreme (deep OTM long) | <1% | Lottery-style buy |
Middle Level: Stress Testing — What Happens in Extreme Conditions?
What is stress testing?
Simulating what your options portfolio looks like under extreme market conditions.
Two core stress scenarios:
| Stress Type | Parameter Change | Typical Trigger |
|---|---|---|
| Large stock move | Stock ±20%, ±30% | Black swan, earnings disaster |
| Volatility spike | IV +20, +40 percentage points | Financial crisis, geopolitical shock |
How to do a simple stress test (Excel or on paper):
Using an Iron Condor as an example:
- Current stock at $100, IV = 20%.
- Position: sold $105 call, bought $110 call + sold $95 put, bought $90 put.
- Received $2 premium; max loss = (5 − 2) × 100 = $300.
Stress test table:
| Scenario | Stock Change | IV Change | Estimated Portfolio Value | P&L |
|---|---|---|---|---|
| Baseline | 0% | 0% | $2 | 0 |
| Small drop | −5% ($95) | +5% | −? | Needs calculation |
| Large drop | −15% ($85) | +20% | Near −$300 | Max loss |
| Large rally | +15% ($115) | +20% | Near −$300 | Max loss |
| Vol spike only | 0% | +20% | Positive or negative? | Depends on Vega exposure |
Advanced tool: Greeks Limits
Setting "limits" for each Greek is like giving your trading an automatic safety check:
| Greek | Example Limit (for a $100k account) | Explanation |
|---|---|---|
| Total absolute Delta | ≤ 2,000 | Equivalent to the risk of 20 shares |
| Total Gamma | ≤ 500 | Higher Gamma → more frequent adjustments needed |
| Per-strategy Theta | $200–$500/day | Expected daily "rental income" |
| Total Vega | ≤ 5,000 | 1% IV rise → lose $50 |
| Per-strategy max loss | ≤ $5,000 (5% of account) | No single strategy can blow up more than 5% |
Top Level: Strategy Resilience — How Robust Is Your Strategy?
What is strategy resilience?
A strategy's ability to remain profitable or break even when conditions deviate from the optimal.
Resilience comparison across strategies:
| Strategy | Resilience | Reason |
|---|---|---|
| Naked put | High | Profitable as long as stock doesn't drop below strike; strike is usually set below support |
| Iron Condor | Medium | Has a "profit zone," but once breached, losses accelerate |
| Long straddle | Low | Needs a big move; Theta erodes daily when directionless |
| Vertical debit spread | Lower | Breakeven zone is narrow; requires accurate directional judgment |
How to improve strategy resilience:
Method 1: Widen the strike spread (Iron Condor)
- Narrow spread (e.g., 5-wide): lower premium, but breakeven zone is narrow — low resilience.
- Wide spread (e.g., 10-wide): higher premium, wider breakeven zone — high resilience, but uses more margin.
Method 2: Extend the expiration
- Short-dated (1 week): high Gamma, volatile pricing, low resilience.
- Longer-dated (2-3 months): slower Theta decay, more time for the trade to work, higher resilience.
Method 3: Use "layered entry" instead of "all-in at once"
Don't enter the full position immediately — scale in:
- First layer: enter 30% of target position
- Second layer: add 30% if the trade moves in your favor
- Third layer: add the remaining 40% if it continues favorably
This "pyramid entry" method gives you a better average price and higher resilience.
A Complete Risk Management Process (Pre-Entry Checklist)

Before entering, ask yourself 5 questions:
- Position size: What's the maximum loss on this trade? Does it exceed 5% of the account?
- Stress test: If the stock moves 10% against me, how much do I lose? What if IV spikes 20 points?
- Greeks limits: After entry, do total Delta, Gamma, and Vega stay within my limits?
- Resilience: How wide is this strategy's breakeven zone? How accurate does my view need to be for this to be profitable?
- Exit plan: Under what conditions will I stop out? Roll? Take profit early?
After entering, check 1-2 times per week:
- Are Greeks still within limits?
- Am I approaching expiration (<7 days)? Do I need to roll?
- Have I hit my pre-set stop-loss or profit target?
Three-Line Summary
- Position sizing: Use Kelly logic and risk-tiered sizing to decide how much to put on per trade.
- Stress testing: Think through "what happens at 2 standard deviations" before entering.
- Strategy resilience: Choose or design strategies with wider breakeven zones and greater durability.